Fun Facts about Thanksgiving Day
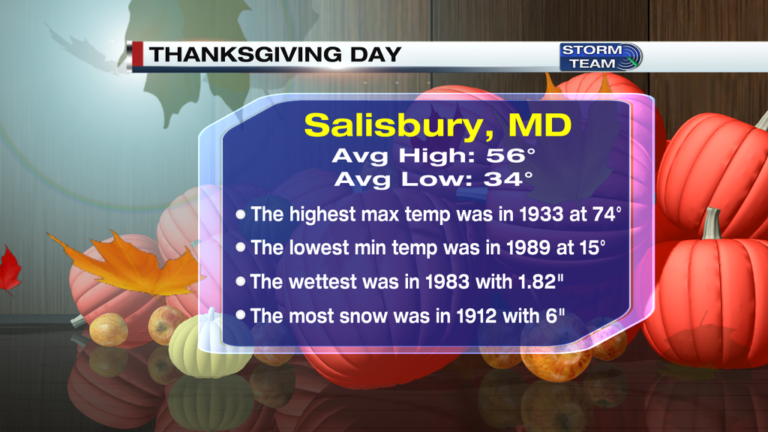
The National Weather Service in Wakefield did a Thanksgiving Day Climatology report on temperatures and precipitation based on data since 1907. Temperatures on turkey day show a high degree of variability. Although temperatures in the 70s are not as common as surrounding areas, there have been 5 instances where they have reached that high. On the other hand, there was the occasional Thanksgiving Day that did not get higher that the 30s.
A standard deviation shows that highs typically range between the mid to upper 40s and the mid-60s. Since 1907, there have only been 6 dates that did not reach at least into the 40s. The variability for low temperatures is not as high, ranging from the mid-20s to the lower 40s. There have actually been two Thanksgiving Days with temperatures dropping below the 20 degree mark.
The wettest Thanksgiving in Salisbury was in 1983 with 1.82″ recorded. Late November seems to be a dry time of the year, with only a 34% chance of receiving measurable precipitation, and a 9% chance of receiving 0.5″ or more. The most snow seen on Thanksgiving occurred in November of 1912, with 6 inches of snow. There is only a 3% chance that we will see measurable snow in Salisbury. The most recent snow on Thanksgiving was back in 1989 with a total of 3″ recorded.
To see the full report and compare Salisbury to surrounding areas click here: Thanksgiving Day Climatology